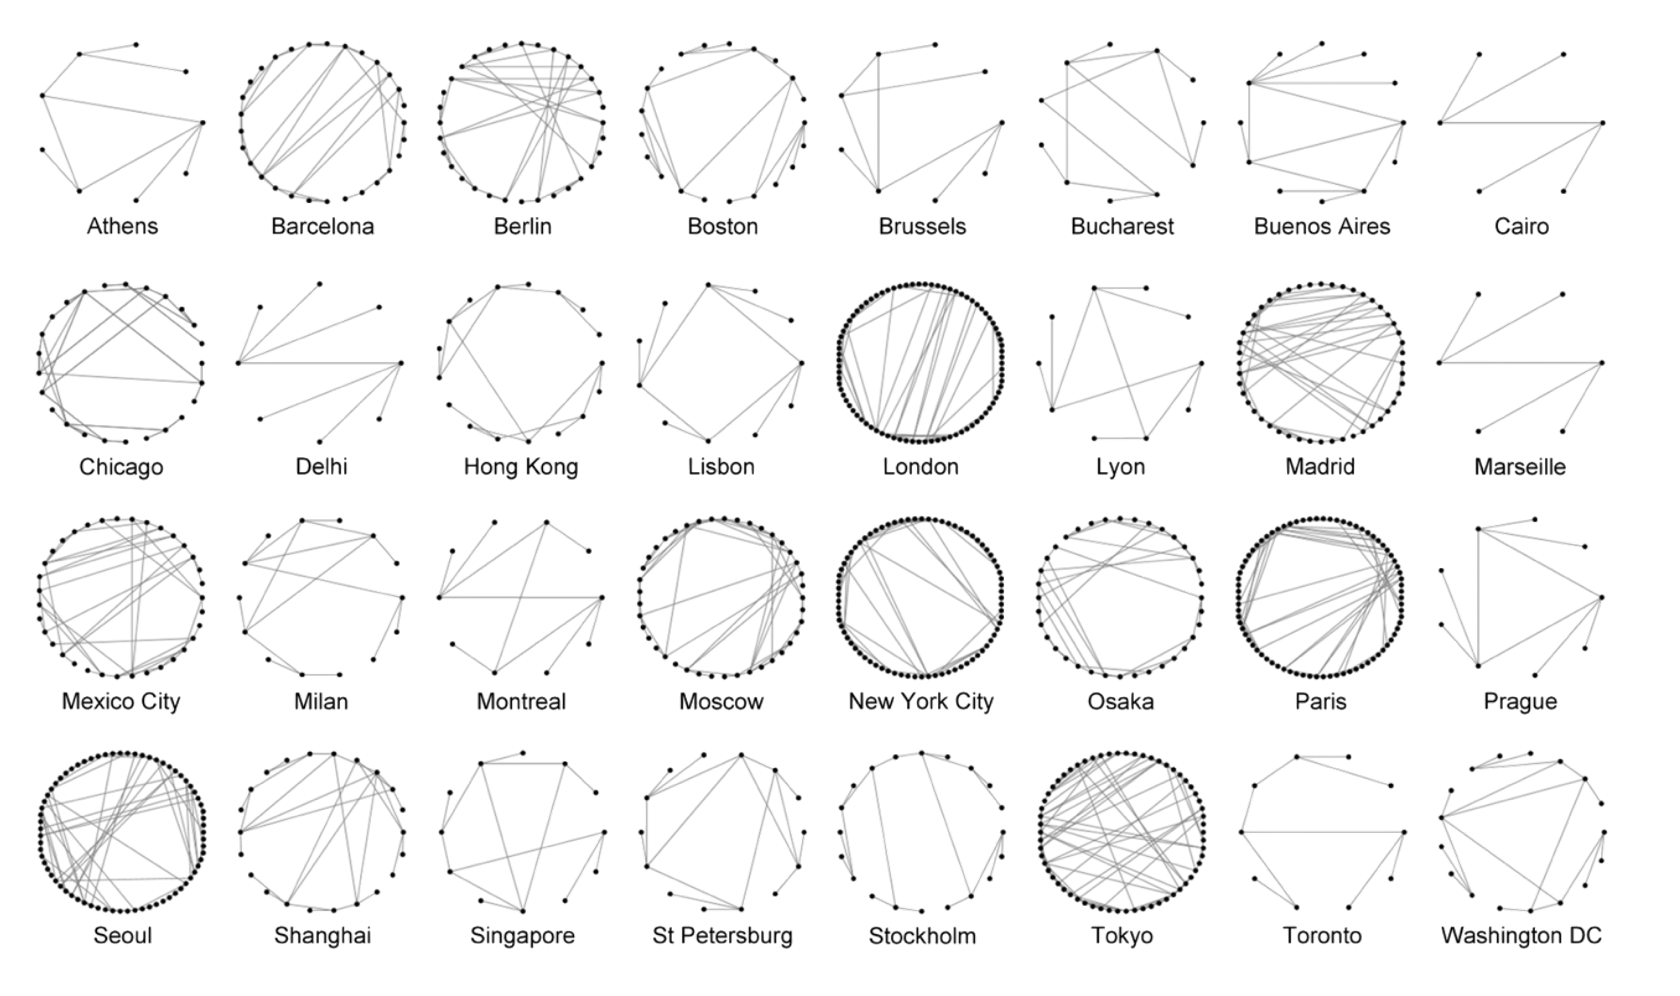
Image source: Derrible, S. (2012). Network centrality of metro systems. PloS one, 7(7), e40575.
Network analysis is a branch of data science gaining a lot of attention from outside, mainly because many aspects of our life can be described using networks, such as fifteenth Century Florentine Marriages, friendships in sports clubs, viral marketing strategies, metro connections, et cetera.
If you are also attracted to network analysis, you may want to do it with R, a free software environment for statistical computing and graphics. Let’s also say that you want to create a network from a list. In this list, every row element is listed in an attribute, as in the following example.
| Basketball | Football | Golf | |
|---|---|---|---|
| Marc | 1 | 10 | 0 |
| John | 0 | 20 | 0 |
| Paul | 5 | 0 | 5 |
| Micheal | 0 | 0 | 5 |
In the scenario, Marc and Paul are “connected” because they both play football, Marc and John are connected because of Basketball, Paul and Micheal are bound by Golf, and so on. You may also want to assume that the link between Marc and John created thanks to basketball is way higher than the one made between Marc and Paul in football. As you may imagine, this can be exploited in many different ways since there are many cases in which a network can be formed from other individuals sharing an attribute (for instance, customers buying the same products).
Let’s take a very generic matrix as an example, and then let’s generate all the possible combinations between the individuals (in our case, they would be Marc – John, Marc – Paul, Marc – Micheal, John – Paul, John – Micheal and Paul – Micheal).
# table with 50 random values
set.seed(345)
inc <- matrix( rbinom(50, 1, p=0.2) , 10, 5)
colnames(inc) <- letters[1:5] # activities
rownames(inc) <- LETTERS[1:10] # individuals

# generate all combinations of individuals
d <- data.frame(t(combn(rownames(inc), 2)), stringsAsFactors = F)
Now, we are going to build a function that is gonna calculate the strength of the link between two individuals by summing the product of the value of each attribute. For example in the example above, is going to calculate the link between Marc and John by applying the following formula:
LinkStrength(Mark, John) = Football(Marc) * Football(John) + Basketball(Marc) * Basketball(John)+Golf(Marc) * Golf(John)
sum_act <- function(x){
  sum = sum(inc[ d[x,"X1"],] * inc[ d[x,"X2"],])
}

d$keep <- sapply(1:nrow(d), sum_act)

head(d)
  X1 X2 keep
1  A  B    1
2  A  C    0
3  A  D    0
4  A  E    0
5  A  F    0
6  A  G    0
Now you will be able to generate your own network object and analyse all its characteristics.
library(igraph)
g <- graph_from_data_frame(d[d$keep>0,], directed = F)
plot(g)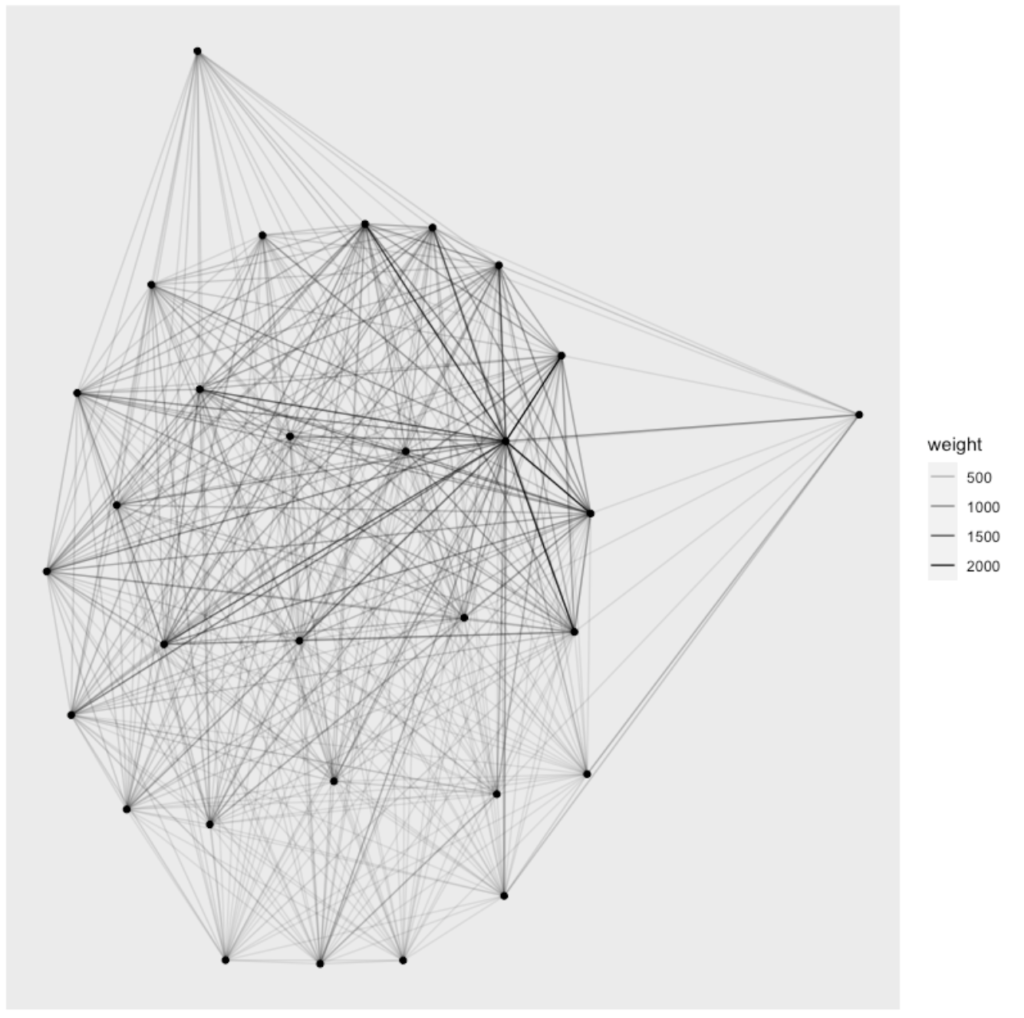
And you? Have you ever done network analysis in R?
Leave a Reply