
Introduction
Have you ever found yourself in a group of people talking in an unknown language? Like going to the beach and founding a quantum physic convention on the seashore? It can be a funny situation, but at the same time, it gives some point of reflection. When you collaborate every day, does an individual’s background have any influence on how and how much he will interact with others?
A network of 27 institutions collaborating on a European project called SoBigData has been interviewed to try answering. SoBigData is a Pan-European, multi-disciplinary research infrastructure for big social data analytics, coupled with the consolidation of a cross-disciplinary European research community, using social mining and big data to understand the complexity of our contemporary, globally interconnected society.
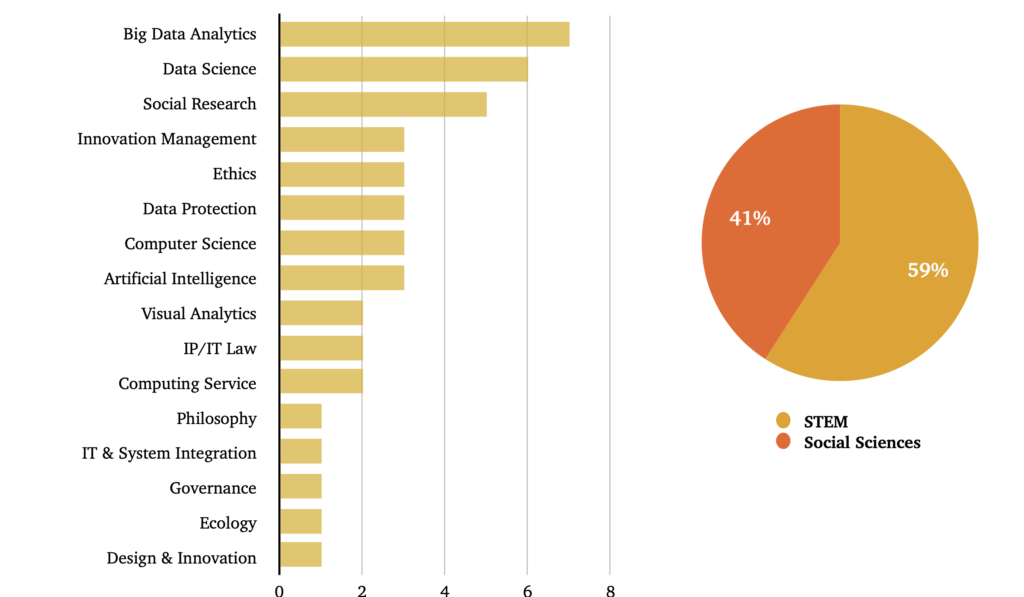
Each of the participants had to express one to three competence they possessed, and the result has been the following (the data is presented aggregated).
Methodology
The driving questions of this question are: the following are institutions talking rare languages? Do they share common languages? How much rare is the contribution of the different actors? After measuring the frequency of each competence, I tracked whether the competence belongs to social sciences or STEM to have a second frequency level. The intuition behind this is that if Big Data Analytics is taken out from the table, it is more likely to be replaced by someone competent in Data Science rather than Philosophy. Thus also the macro competence influences the rarity of each competence. As a final step, a rarity score is generated for each competence, following the formula Rarity = 1 / (C.F. * M.C.F), where C. F. is competency frequency, and M. C. F. is macro competence frequency. It is then taken the reciprocal of the result to ensure that this rarity score increases with the decrease of the frequency (which means that the rarity increases).
After completing the last calculations, each competence has a rarity score, but it does not immediately mean that also each institution has a rarity score. The next step is grouping the different rarity scores per institution, and the procedure that has been chosen was to select the maximum and minimum score of competence held by each one. Of course, institutions with one competence have max and min rarity scores matching, taking from the same competence. In contrast, the institutions with two or three competencies have dissimilar rarity scores.
Findings
It is possible to notice that organizations with one competence lay on the bisector of the axes, while below them, organizations with more than one competence are plotted. Furthermore, the organizations do not have rare languages or competencies on the left side of the chart, while one of the left has at least one occasional language. It is helpful to juxtapose the mean value of the maximums perpendicularly to the x-axis to visualize the two groups better.
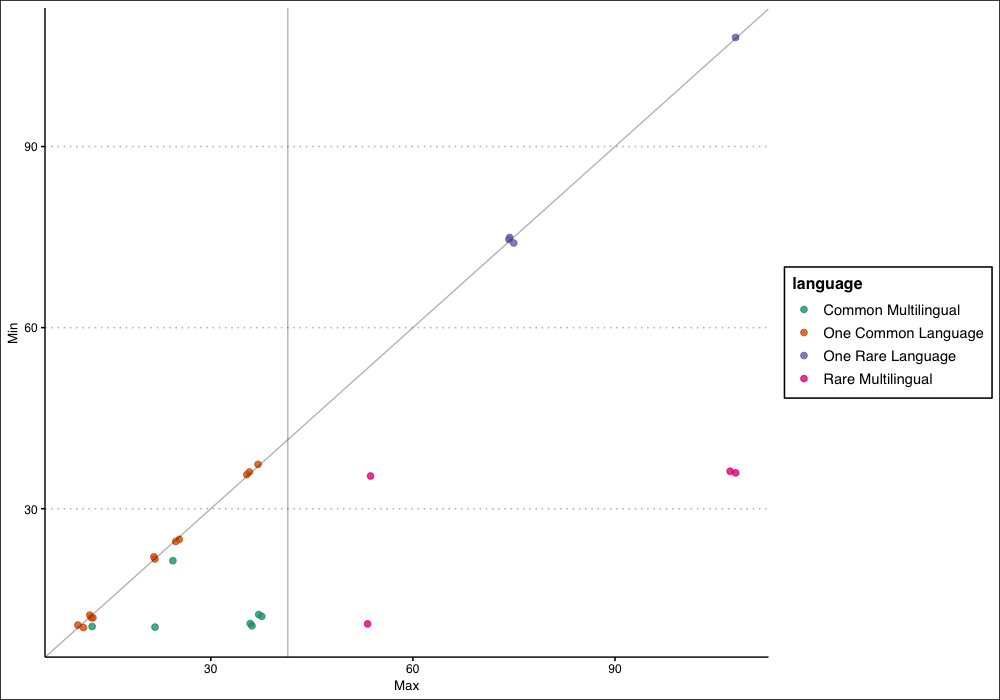
Using these two points of view, it is possible to identify four different categories of institutions:
- Common multilingual (more than a common language)
- One common language (one language)
- One rare language (one rare language)
- Rare multilingual (more languages, of which at least one is rare)
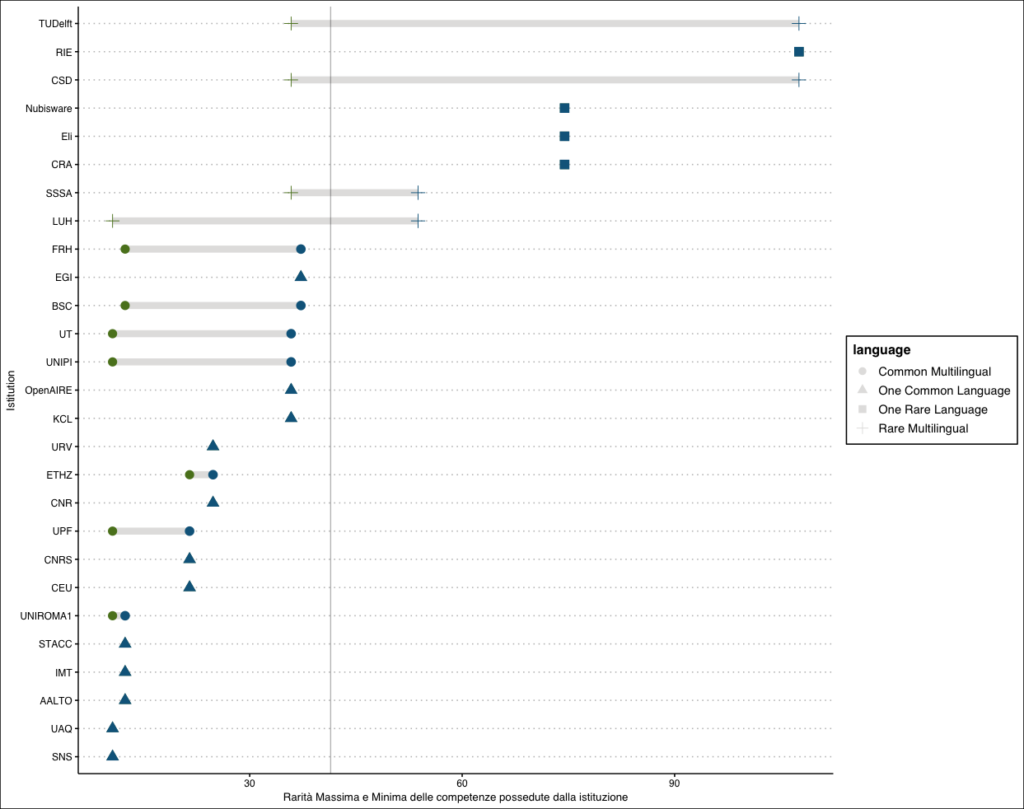
It would be interesting also to try to visualize the language skills of each institution as a range, using the following graph. The green point represents the minimum rarity score of the organization, while the blue one is the maximum. The shape of the attribute represents the belonging category.
I believe that this little study could be useful to understand that the capacity of an individual to interact with others, could be a consequence of the uniqueness of its language. Stay tuned for more articles regarding the consequence of the model.
Inspiration for the research:
- Pittaluga, F., et al. “Analyse de la pauvrete dans les communautes de peche artisanale autour du plan d’eau de Selingue, Mali.”
- Thomas, Vinod, Yan Wang, and Xibo Fan. Measuring education inequality: Gini coefficients of education. The World Bank, 1999.
- Cheli, B., et al. “Measuring Poverty in the Countries in Transition via TFR Method: The case of Poland in 1990-1991.” Statistics in transition 1.5 (1994): 585-636.
Leave a Reply