
Network Centrality Measure
In the last articles, we explored different aspects of network theory. After introducing networks and their presence in everyday life, we tried to understand how to create one in R, starting from a list of members sharing different interests or activities.
Let’s start adding another layer of deepens by exploring the concept of centrality. Given a network, the centrality measures how often a given node is in the path that connects two different nodes, thus the importance of a specific node.
The betweenness centrality is one of the measures of centrality. It is based on the concept of shortest paths. For every pair of vertices in a connected graph, it is possible to identify one quickest path such that between the vertices, either the sum of the weights of the edges (for weighted graphs) or the number of advantages that the path passes through (for unweighted graphs) is minimised. The definition is not always valid: if the network is not connected enough and oriented, it may not be possible to find the shortest path. In other words, betweenness centrality calculated for each vertex represents the number of these shortest paths that pass through the vertex.
In network analysis, measuring a node’s centrality is fundamental and have many practical applications, such as knowing which metro stations are crowded in bug cities or build the most famous 2 trillion-dollar company with a search engine.
Social vs Formal centrality
When you run network analysis, it always involves connections formed among people, organisations, humans. And you may wonder whether psychology and emotions actually play a role (short answer: definitely yes).
To test this hypothesis, we took the SoBigData project participants mentioned in the last article (super-short summary: a set of 40 organisations collaborating to a European project that has as output the creation of a data mining platform for European researchers).
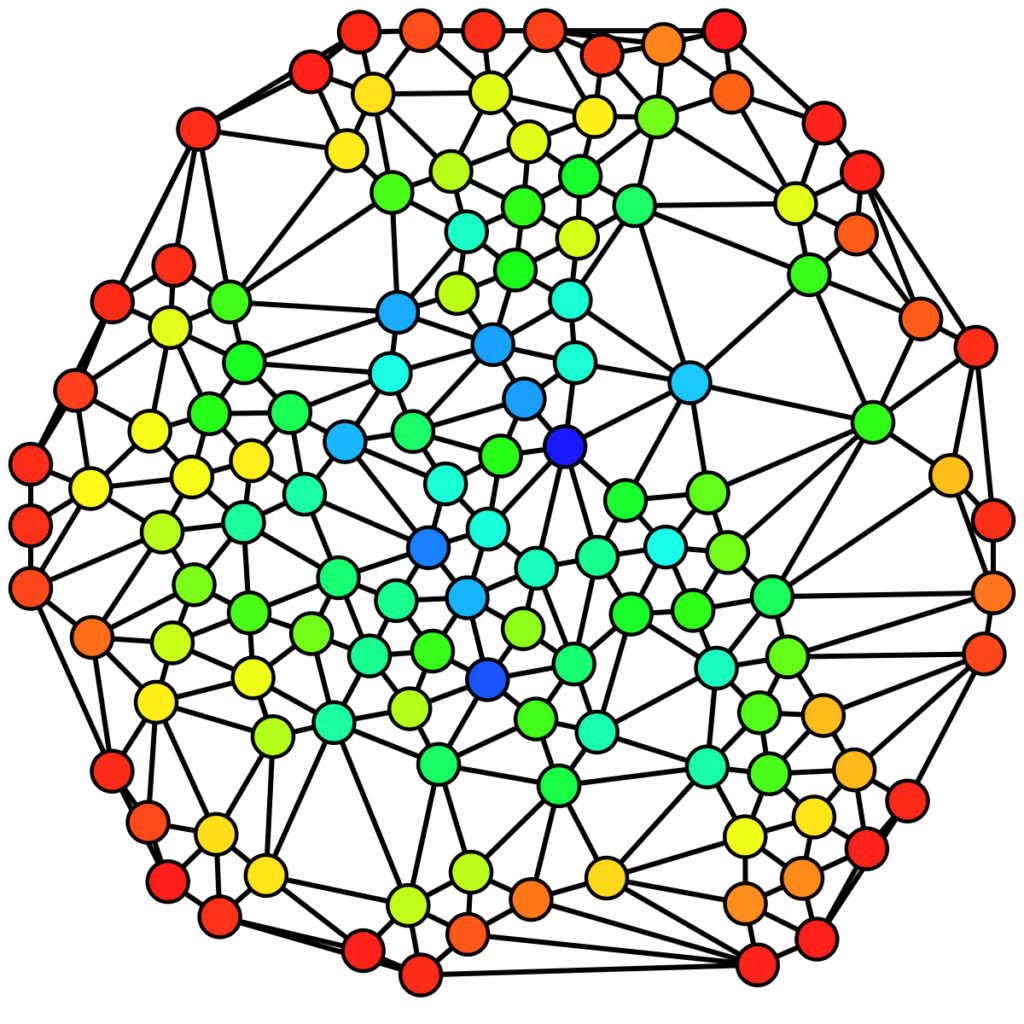
We tried to measure their “formal centrality” and their “social centrality” with two methods. The first one resulted from project managers’ planning. Essentially, the different organisations had to collaborate on other sub-projects called “Work Packages”, as in the image below:

The centrality measure elaboration has the distribution of work packages defined in the official documentation, which generates an edge list. Then, it is calculated the specific weight for each link. The weighted edge list gets then transformed into an R network object through the function graph_from_data_frame(). The network is then used as input for the function graph.strength() to obtain each node centrality.
Regarding the perceived network analysis, the process has been similar to the one seen before. However, the input chart is slightly different because it was based on organisation perception. Every organisation were asked to rate their collaboration with all the other parties on a scale from 1 to 5. This kind of table is called the adjacency matrix, and it is fundamental to apply the function graph_from_adjacency_matrix() to generate R object, and then again with graph.strength() node centrality is computed in the same way.
Findings
At this point, each institution has two centrality scores. Contrary to what may be thought, a high value of perceived centrality does not correspond to a high value of formal centrality. In the graph below, both centrality measures have been normalised from zero to one and plotted to one of the two axes. The two median centrality values have been then traced as perpendicular to the two axes. The result is that organisations can fall into four different categories of centrality:
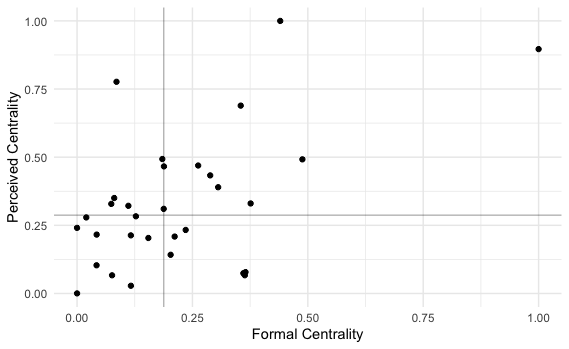
- The ones formally and subjectively central
- Secondly, the ones formally prominent but subjectively secondary
- The ones formally secondary but subjectively central
- Lastly, The ones formally and subjectively secondary
As always, you need to be careful in understanding the human element when analysing your data. Be ready to spark exciting conversation comparing what is perceived and what is supposed to be!
Leave a Reply